


Market Realist
By Adam Jones Feb 26, 2016 1:29 pm ES
How Have Phosphate Fertilizer Prices Moved in February? (Part 1 of 4)
Phosphate prices
Farmers around the world use different types of phosphate fertilizers depending on the type of soil and crops to be planted. The most common phosphate fertilizer utilizes MAP (monoammonium phosphate), DAP (diammonium phosphate), and TSP (triple superphosphate).
According to the IPIN (International Plant Nutrition Institute), TSP is less popular due to its lower total nutrient content compared to ammonium phosphates.
DAP prices fell
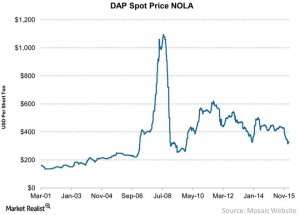
The average prices of DAP have been falling over the past few months, as shown in the chart above. However, DAP prices bounced back from $314 per short ton in January 2016 to $330 for the week ending February 19, 2016, at NOLA (New Orleans).
The average price of phosphate has risen from the level of $324 per short ton a week ago, but it remains lower than $447 per short ton from a year ago. The YoY (year-over-year) downward trending situation has been similar for prices in Tampa, Morocco, and CFL points.
Revenue for fertilizer companies is a function of fertilizer price and shipments. The falling price of DAP puts pressure on companies that produce and market DAP. This particularly affects the Mosaic Company (MOS), as the phosphate segment contributes about 55% to its operating margins.
The Mosaic Company, PotashCorp (POT), Israel Chemicals (ICL), Yara International, Agrium (AGU), Uralkali, and Belaruskali are some of the largest producers of phosphate fertilizers.
You can access some of these companies through the Materials Select Sector SPDR ETF (XLB), which invests 12% of its portfolio in agricultural chemicals.
PART 2
How Have Phosphate Fertilizer Prices Moved in February? (Part 2 of 4)
Why Phosphate Inventory Has Remained Unchanged in February
By Adam JonesFeb 26, 2016 1:29 pm EST
Why consider inventory?
Previously in this series, we looked at phosphate prices, which are a function of supply and demand. When there is an increase in inventory levels, it indicates that fertilizer supply is outpacing demand. This puts downward pressure on phosphate prices.
Bear in mind that manufacturers may adjust production in anticipation of weaker demand, but this lags. If inventory reaches a certain level, it usually retracts due to cyclicity in demand.
Inventory levels
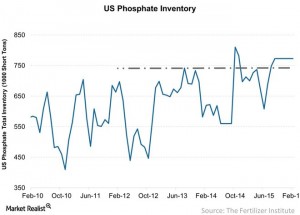
The United States is the third-largest importer of phosphate fertilizers, according to the Mosaic Company (MOS). The above chart shows that inventory levels as of February 2016 stand at 773,000 short tons, above the peak of 737,000 short tons in April 2015. One short ton equals 0.91 metric tons.
Inventory volumes in February 2016 rose by ~10% in the United States YoY (year-over-year), which could be the result of higher production compared to the same period a year ago. However, inventory levels are unchanged from January 2016.
These trends are negative and can impact players such as Agrium (AGU), the Mosaic Company, PotashCorp (POT), Israel Chemicals (ICL), Yara International, Uralkali, and Belaruskali. Some of these companies are also held by the Materials Select Sector SPDR ETF (XLB), which invests 12% of its portfolio in agricultural chemicals.
In the next part, we’ll look at the price of phosphate rock, an input material for phosphate fertilizers.
PART 3
How Have Phosphate Fertilizer Prices Moved in February? (Part 3 of 4)
A February Phosphate Rock Price Update
By Adam JonesFeb 26, 2016 1:29 pm EST
Phosphate rock
The production of phosphate fertilizers begins with phosphate rock. About 75% of global phosphate reserves are in Morocco, according to PotashCorp (POT), which also produces phosphate fertilizers.
Phosphate rock prices
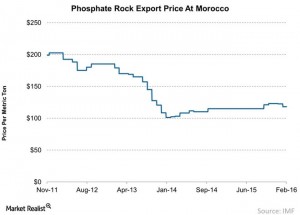
Phosphate rock prices in February 2016 have fallen to $118 per metric ton from $122.5 per metric ton, higher than $115 per metric ton in February 2015. Earlier in this series, we saw that phosphate fertilizer prices have dropped over the same one-year period.
In an environment of increased input costs such as the cost of phosphate rock, the result can be the squeezing of gross margins for companies such as PotashCorp and the Mosaic Company (MOS) when fertilizer prices fall.
You may want to consider the Materials Select Sector SPDR ETF (XLB), which invests 11.6% in Dow Chemicals (DOW) and 8.6% in Monsanto (MON).
Mosaic’s outlook
The above situation is anticipated to continue, which may explain why Mosaic predicted a fall in its margins for its upcoming 1Q16 quarter. You can read more at Mosaic’s 4Q15 Earnings: Nice Surprise, but What’s Next?
Note that ammonia and sulfur are two other input materials required for making phosphate fertilizers. We’ll look at the prices of these two raw materials in the next part of this series.
PART 4
How Have Phosphate Fertilizer Prices Moved in February? (Part 4 of 4)
Phosphate Input: February’s Sulfur and Ammonia Prices
By Adam JonesFeb 26, 2016 1:29 pm EST
Sulfur and ammonia
Sulfur and ammonia are two raw input materials besides phosphate rock that are required for making phosphate fertilizers.
Input prices fell
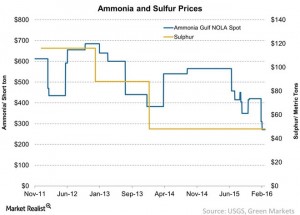
Prices of ammonia have fallen over the past one-year period and are trading at $271 per short ton—one short ton being 2,000 pounds—in February 2016.
Ammonia is a nitrogen-based fertilizer is made with natural gas or coal. The prices of both natural gas and coal have been falling over the years. Because natural gas is available in abundance, lower prices encourage more players to enter the market, creating a supply glut and pushing prices down.
CF Industries (CF), Terra Nitrogen (TNH), PotashCorp (POT), and CVR Partners (UAN) are some of the largest producers of nitrogen fertilizers in North America. The former three companies use natural gas as input material, while CVR Partners (UAN) uses coal as input material to produce nitrogen fertilizers. The Mosaic Company (MOS) will be sourcing its supply from CF Industries.
Some of these companies are held by the Materials Select Sector SPDR ETF (XLB), which invests 12% of its portfolio in agricultural chemicals.
More recently, the prices of natural gas have started to increase. They are anticipated to continue to rise in 2016 and 2017, according to the U.S. Energy Information Administration. To learn more, you can read Fertilizer Gone Wild? Your February Update and 2016 Outlook.
Sulfur prices have remained flat over the same one-year period, trading at $48 per metric ton—one metric ton being ~2,206 pounds—in February 2016.


